Location Data in Action: Valentine’s Day Edition.
Love is in the air, and so is location! Check out our location-based insights from Valentine’s Day in 2019.
By Joseph Green
High quality location data can help answer all kinds of questions. For example: What is the best way to retarget relevant audiences for an ad campaign? Or maybe: How can you devise an ambulance dispatch methodology that takes into account changes in human movement and mobility following a natural disaster? Or even: Do more people go to fast food joints or four star restaurants on Valentine’s Day?
Alright, I’ll admit that the last one is pretty niche. But in the spirit of the holiday, the team at X-Mode decided to do a little analysis this last Valentine’s Day. We looked at device behavior on our platform for Valentine’s Day in 2019, and determined the most popular dining destinations in major cities across the United States. The results were not only informative and surprising; they demonstrated the kind of insights you can gather from access to X-Mode’s premium location data.
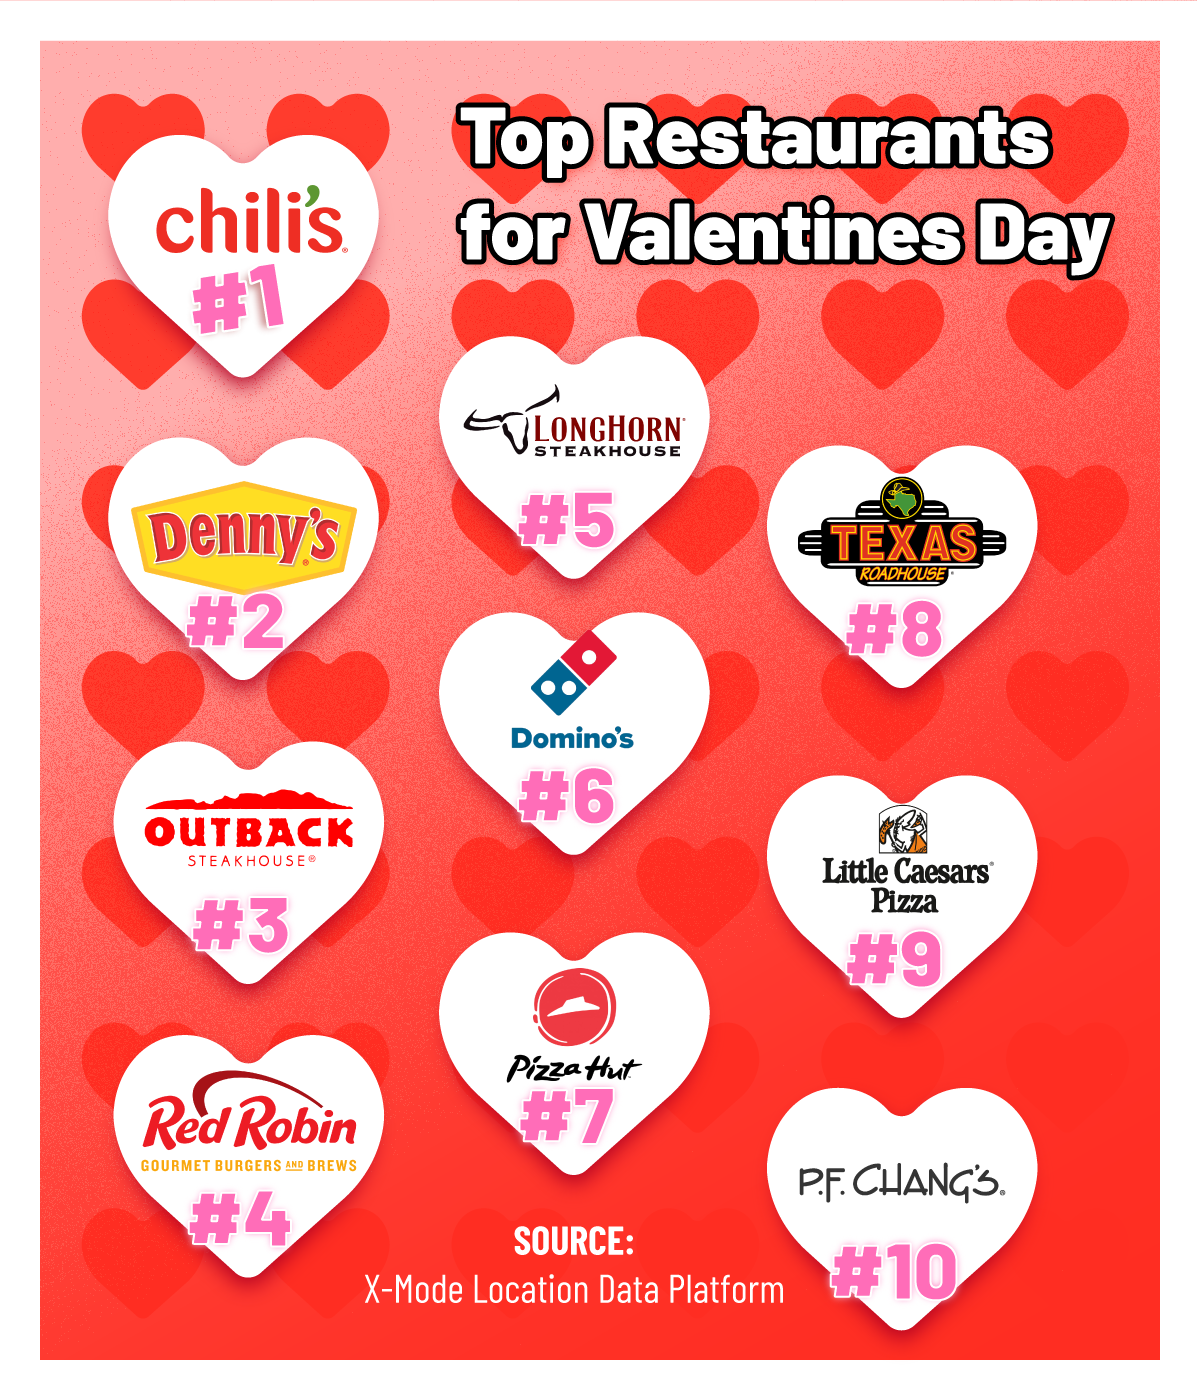
X-Mode has all types of restaurants on our platform, from luxury dining to fast food joints. It comes as no surprise that the less pricey chain restaurants were more popular nationwide last Valentine’s Day; for one thing, there are simply more locations to choose from, in contrast to exclusive five star restaurants with smaller dining rooms. For that reason, our list reads more like a shopping mall directory than a Michelin guide.
Some restaurants still came out on top, though, and that’s a big deal. Valentine’s Day is a huge boon for the restaurant industry, as more people dine out (an average of 51%, according to a National Restaurant Association survey) and checks on average are much higher. Most of the restaurants that topped our list took advantage of the holiday, offering promotions to attract diners who may be looking for a more budget-conscious meal. Chili’s, which saw the highest amount of traffic on our platform, offered a tantalizing $25 meal-for-two deal.
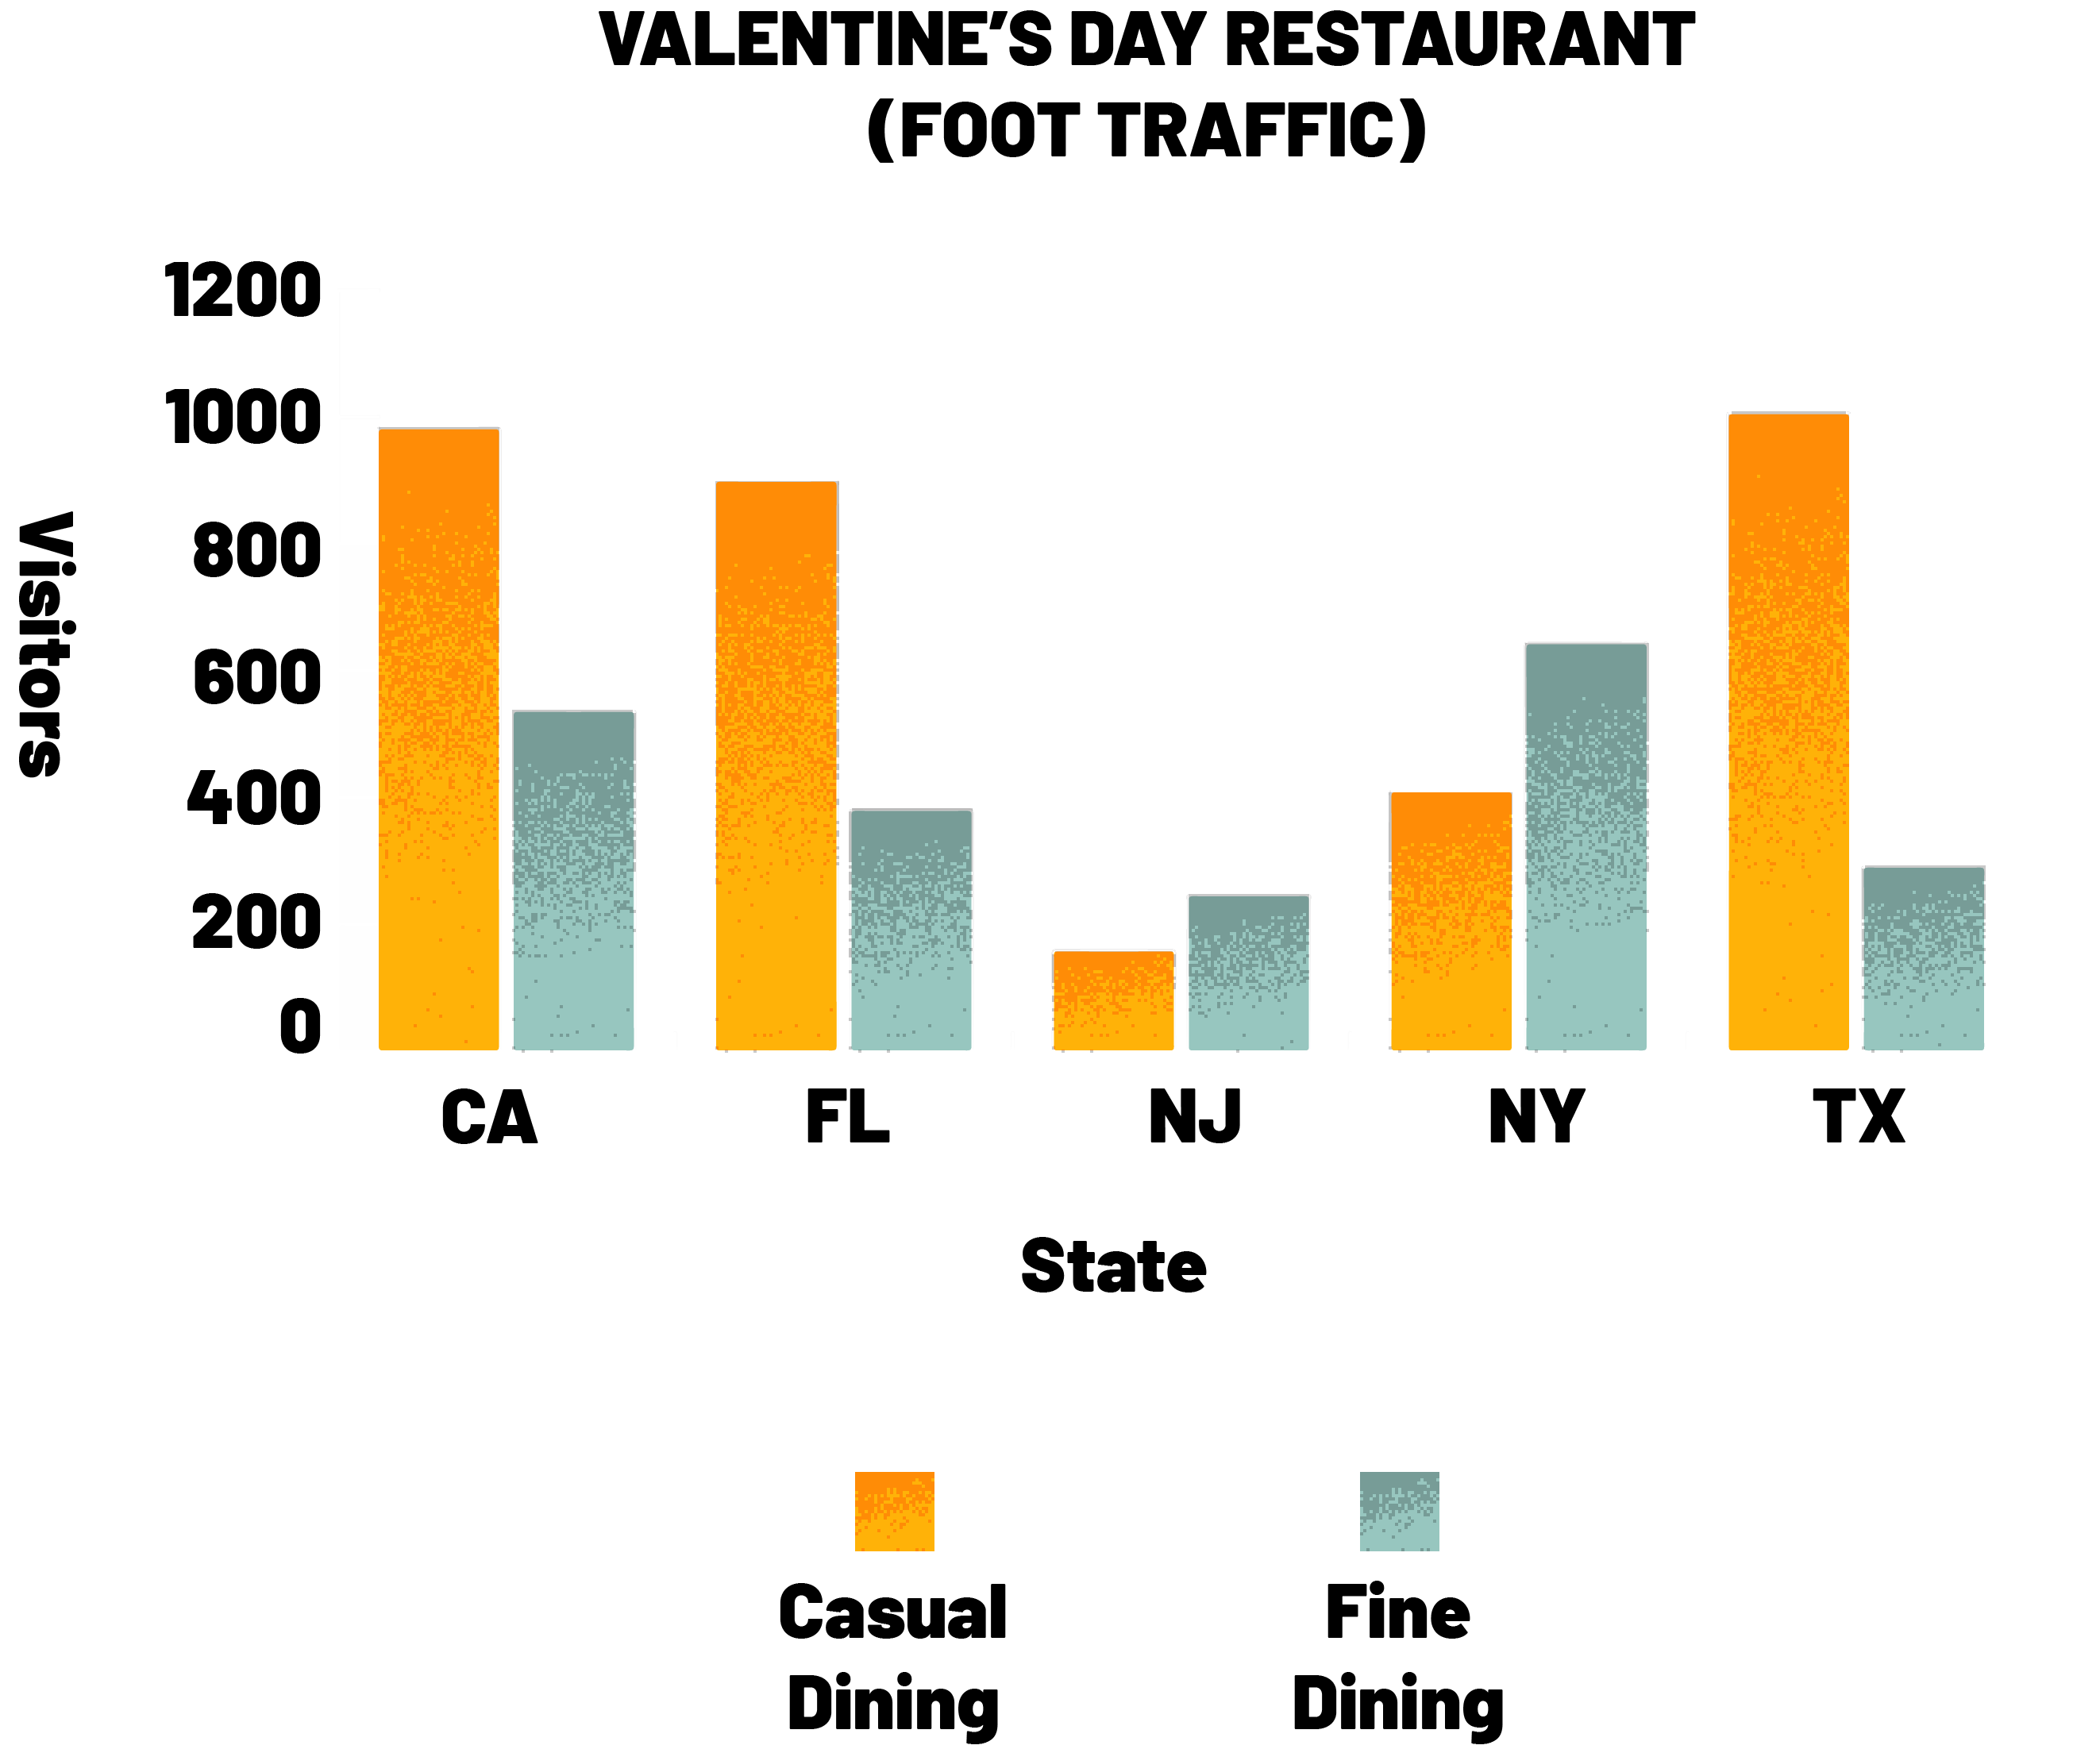
The ratio of casual diners to fine diners was not the same across the entire country. In the most populous states on our platform, there were some marked differences. In many East Coast states, there were more visitors to fine dining establishments than casual dining. In New York, 61% of diners went to fine dining establishments. In New Jersey the number was also around 60%. Contrast those numbers with California, where only about 35% of diners went to fine dining restaurants. In Florida the number was even less, with just under 30% of diners visiting higher scale restaurants. In Texas, the number was just 22%.
X-Mode’s analysis is not able to paint a complete picture of what every American was doing on Valentine’s Day in 2019. But as our platform grows to 60 million Monthly Active Users in the US, our results increasingly reflect the real movements of consumers. These kinds of insights don’t just make for a comepelling blog post; they can help nationwide chains figure out which cities to target with special promotions, and which locations are less worth the effort. Once again, the possibilities are as limitless as your imagination when you have X-Mode’s location data in your arsenal.
Did you learn something about location data analytics today? X-Mode’s premium, 100% SDK-sourced location data is an indispensable tool for everything from segment-based marketing to modern gov-tech solutions. To learn more, and see how location data can help your business succeed in the modern digital landscape, head over to our data licensing portal, or reach out to us today on our contact form.


